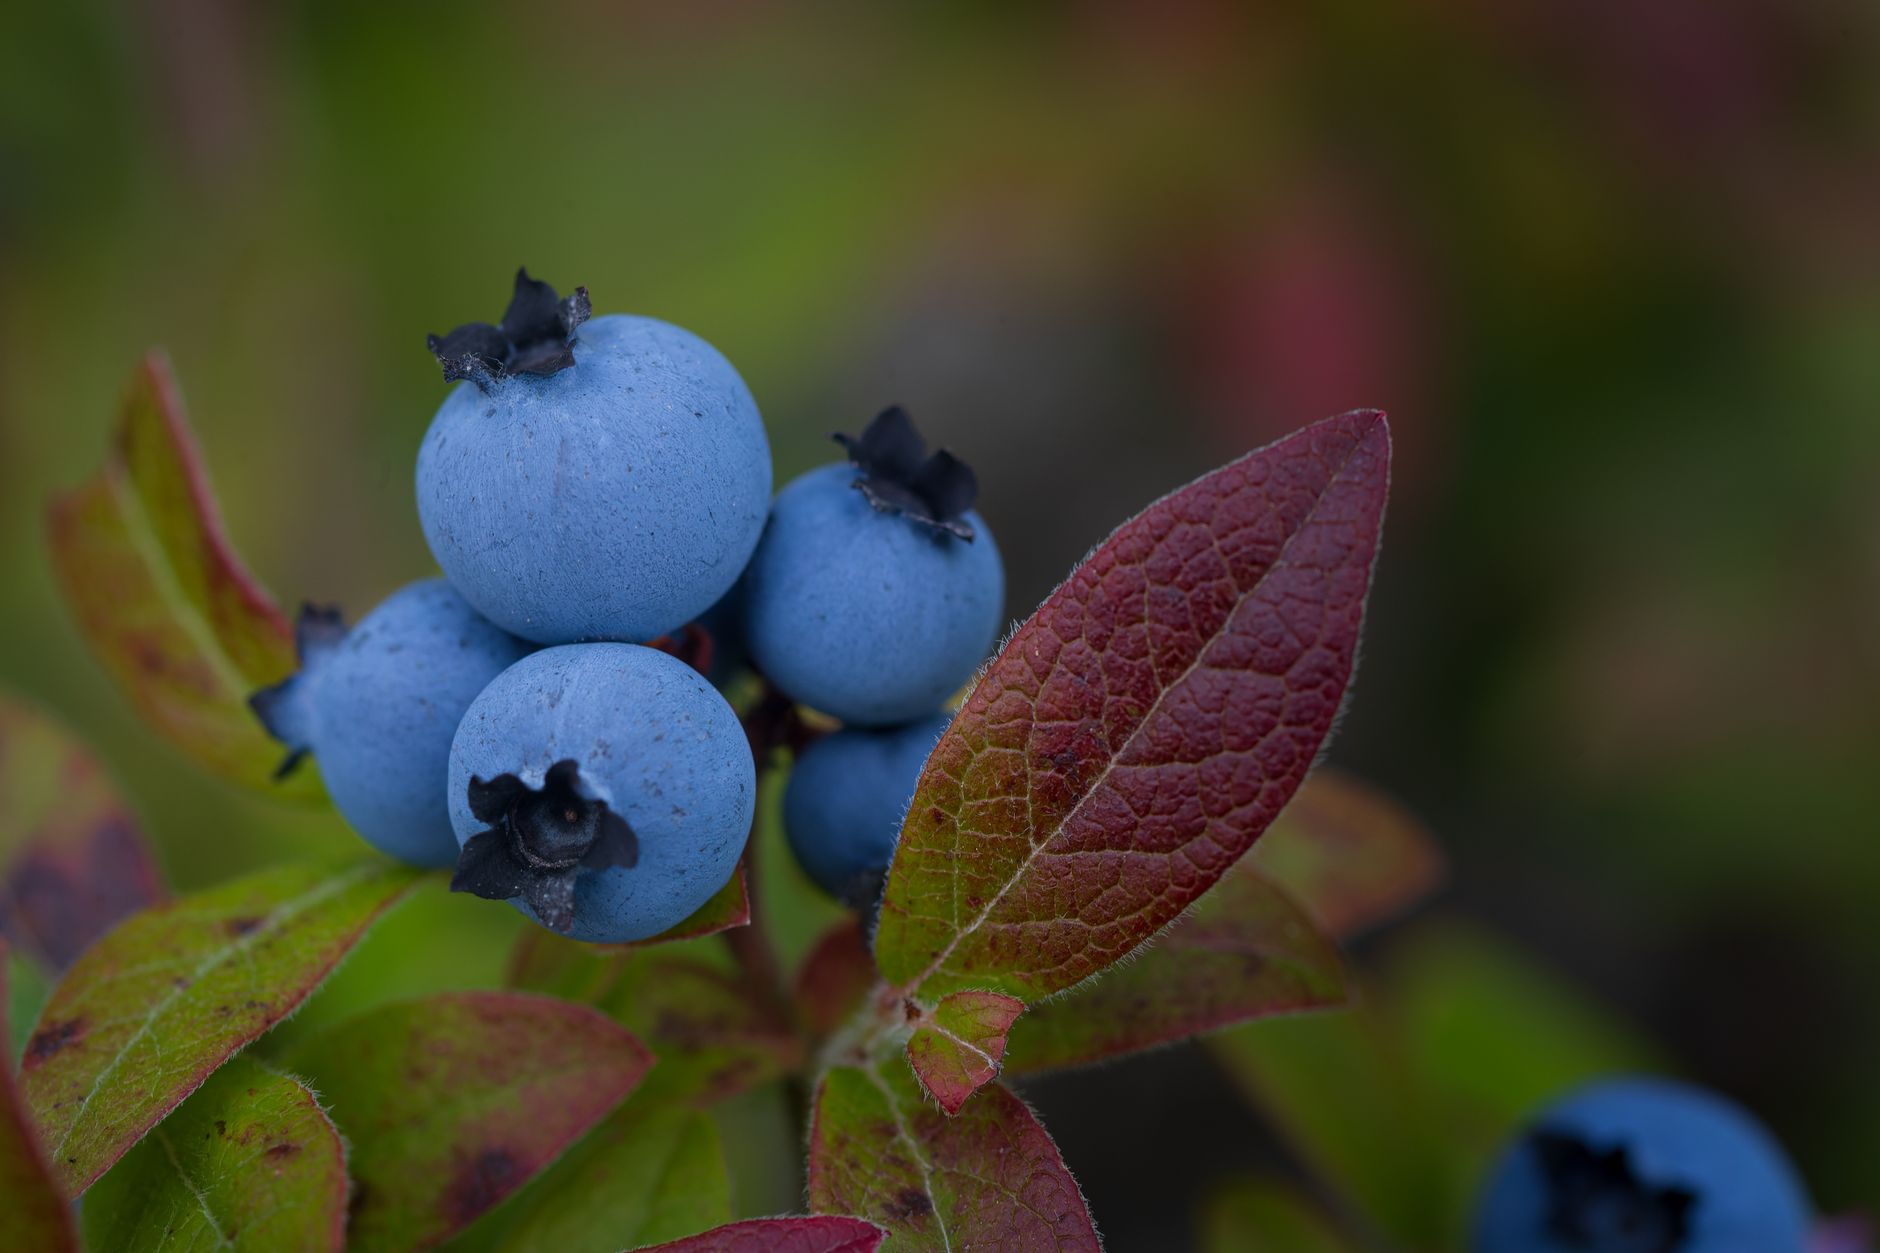
What is a blueberry?
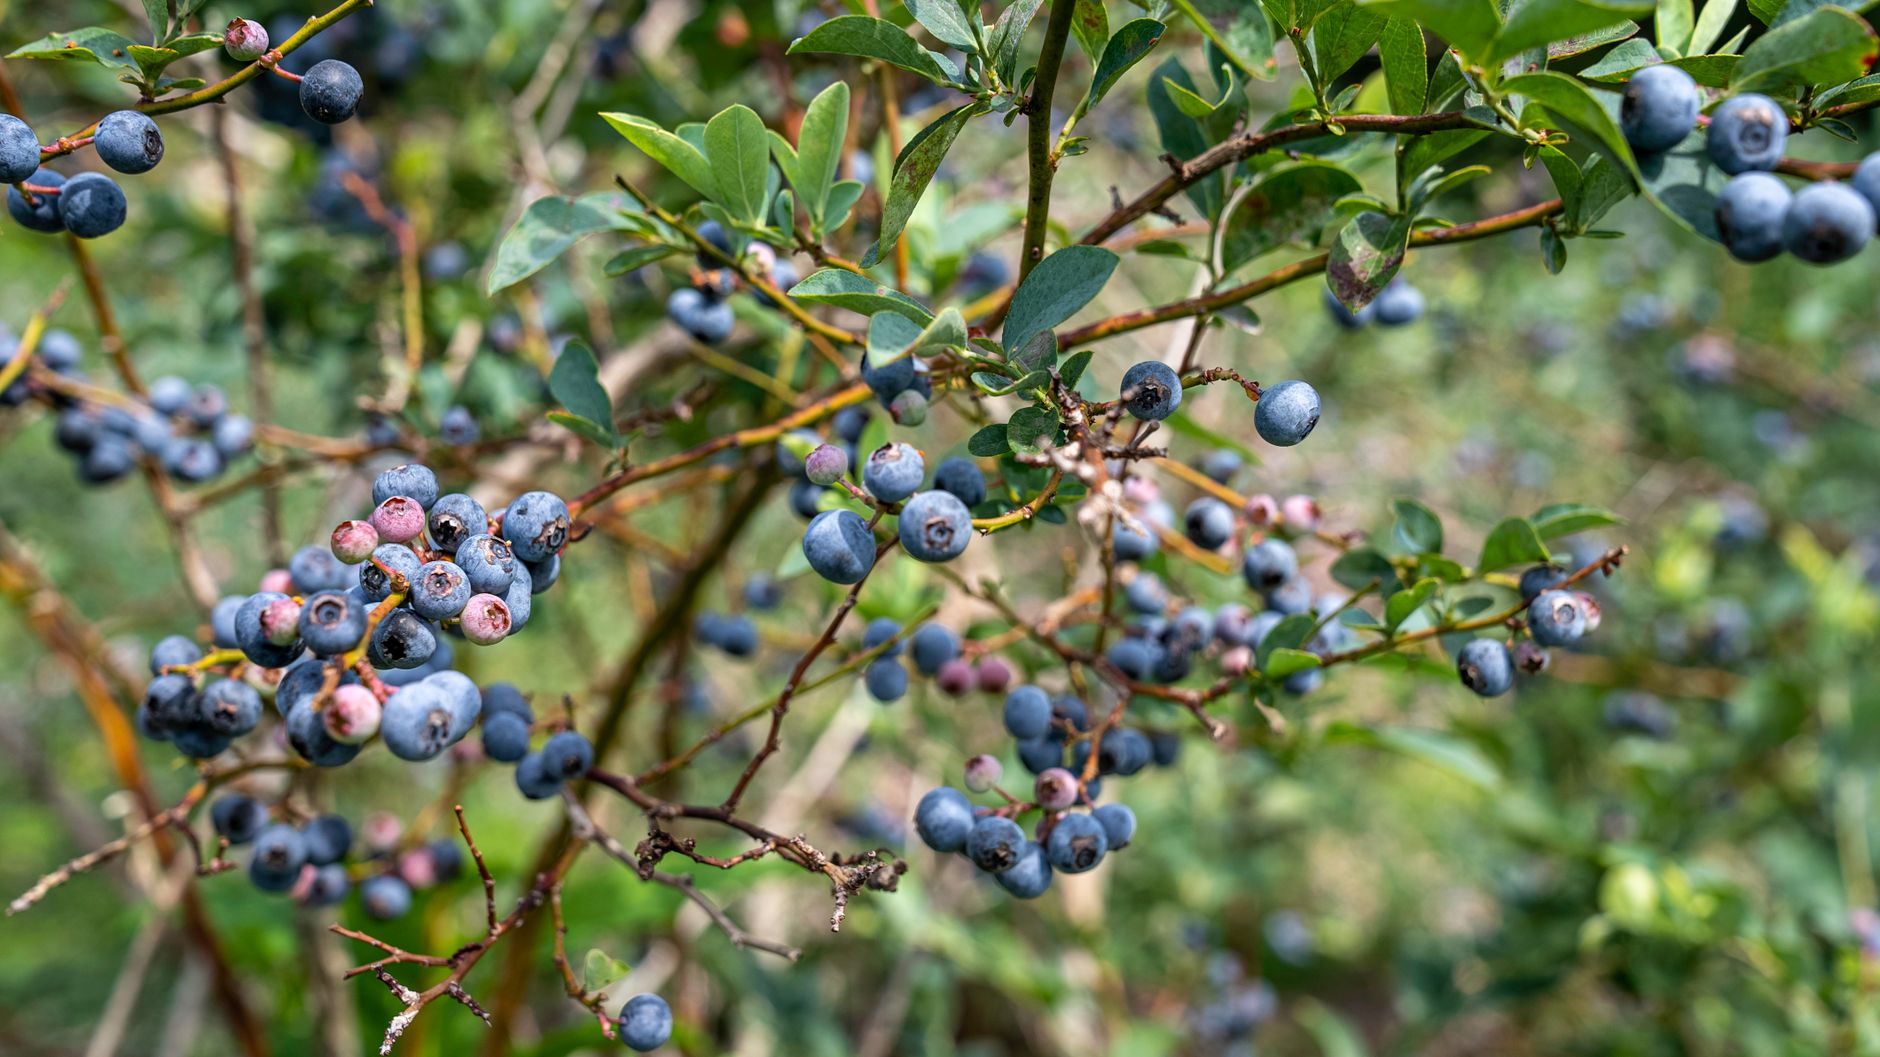
A small edible berry from plants in the genus Vaccinium. Commercial cultivation includes northern highbush, southern highbush, rabbiteye and other types; wild lowbush blueberries are another market.
From the farms of China to the export ports of Peru, discover who grows, ships, and buys the world's blueberries—and why those aren't the same countries.
Catch falling blueberries, dodge the sneaky lemons and earn your very own Berry Champion badge. No downloads, no login—just fun.
698,660 tonnes produced in 2024.
329,090 tonnes of fresh cultivated blueberries exported.
~310,000 tonnes of fresh blueberries imported.
China leads cultivated production, followed by the United States and Peru. These 2024 figures include both fresh-market and processing fruit.
Source: International Blueberry Organization, Global State of the Blueberry Industry Report 2025, 2024 cultivated production table.
Fresh blueberry exports are led by Peru. Import markets are led by the United States. The Netherlands is an important gateway that also re-exports imported fruit across Europe.
2024 export volume · thousand tonnes
2024 volume · selected major markets
Europe can import a berry into Rotterdam, then trade it across a second border. Importer and exporter rankings can both include the Netherlands.
A simplified example of how a blueberry grown in Peru can reach a supermarket overseas.
Growers harvest ripe berries and pre-cool them to protect freshness.
Grading, packaging and refrigerated shipping keep fruit market-ready.
Importers distribute fruit to retailers; Dutch logistics can route it onward within Europe.
Why blueberries grow where they do, how growers cultivate them, and what the numbers really mean.
A small edible berry from plants in the genus Vaccinium. Commercial cultivation includes northern highbush, southern highbush, rabbiteye and other types; wild lowbush blueberries are another market.
Blueberries typically thrive in acidic, well-drained soil, commonly around pH 4.5–5.5. Different cultivars suit temperate regions or warmer, low-chill growing zones.
Growers manage soil acidity, irrigation, pollination, pruning and pests. Harvested fruit is sorted and cooled rapidly; export quality relies on firmness, shelf life and taste.
Some blueberries enter stores fresh; others are frozen or turned into juices, jams and ingredients. Their export statistics and commodity classifications are not interchangeable.
Different growing seasons in northern and southern hemispheres allow retailers to offer blueberries year-round. Peru and Chile complement northern production periods.
Profit depends on cultivar, yield, quality, labor, shipping distance, access to buyers and cold-chain performance—not simply how many tonnes a country grows.
Clear answers to commonly confused trade terms.
China leads global cultivated blueberry production in the IBO's 2024 figures, at approximately 698,660 tonnes.
Peru, at approximately 329,090 tonnes of fresh cultivated blueberries in 2024. Exporting is different from producing: much of China's crop serves domestic demand.
Major destinations include the United States, the Netherlands (often an entry point for European distribution), the United Kingdom and China. The precise destination mix changes by season and year.
Dutch trading and logistics companies import blueberries from producing countries and distribute or re-export them throughout Europe. Exports are not necessarily domestically grown fruit.
Trade datasets may measure value or volume, calendar versus crop years, fresh cultivated blueberries versus all berries, and direct exports versus re-exports. The six-digit HS 081040 category includes other Vaccinium berries; it is not blueberry-only.
No. This is a sourced 2024 snapshot published in 2025. Later years may have provisional country data, but those figures have not been mixed into this comparison.
The same berry can be counted in different ways. For clarity, source, year and measurement are stated explicitly.
Method: Production and fresh-export bars use the IBO 2025 report (2024 cultivated blueberry figures, thousands of metric tonnes). Selected import market data: USA from USDA's 684 million pounds (rounded to ~310,000 tonnes); Netherlands, Germany and UK from World Bank WITS / UN Comtrade HS 081040 (includes other Vaccinium berries). Therefore imports are indicative and not strictly blueberry-only or an exhaustive top-country ranking. Volume is different from export value. Re-exports can appear in global trade totals.